
Contact Us!
For more information on the Fan Flow Integrated Research Laboratory, contact Dr. Lei Fan.
Report a Problem
To report a problem with this website, contact BME Communications, or report an accessibility issue.
Heart failure is prevalent problem affecting the health of individuals worldwide. With an aging population, it is projected that roughly 8 million Americans will be affected by the disease by 2030. While heart transplantation remains the optimal treatment for heart failure, the shortage of available, transplant-worthy organs makes mechanical ventricular assistance a common intervention. With intervention using a left ventricular assistive device, 50% of recipients experience right ventricular failure after implantation. In addition, the complicated nature of disease onset and management prevent the effective utilization of existing therapeutic options.
With this in mind, the Fan Flow Integrated Research Laboratory seeks to develop a biventricular finite element model to investigate the factors affecting interventricular interactions after left ventricular assist device implantation. To accomplish this, the F2IRL will capture data from laboratory experiments and utilize existing experimental models and relevant data. The completion of this project will provide insight into interventricular interactions in LVAD recipients, contributing to improved patient outcomes and reduced mortality rates for heart failure patients for generations to come.
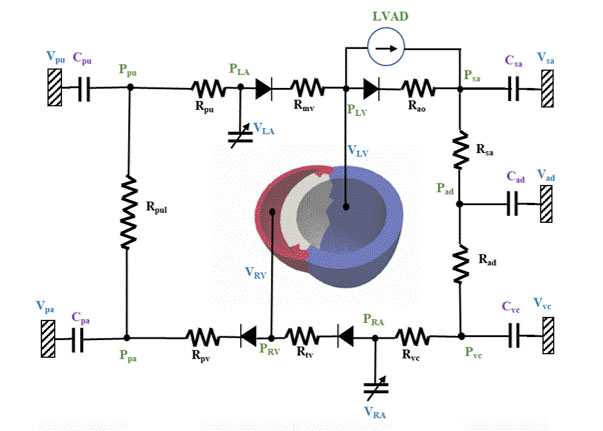
Image: Schematic of the closed-loop lumped parameter framework that couples the LVAD and biventricular model
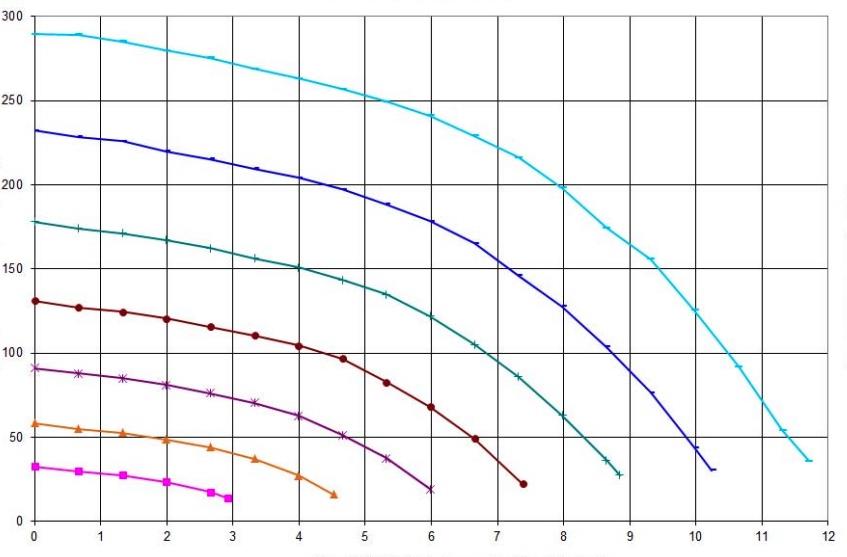
Image shows head (y axis) vs flow (x axis) of blood in heart at pump inlet after implantation of left ventricular assist device at speeds of 3K (pink), 4K (yellow), 5K (purple), 6K (brown), 7K (green), 8K (blue) and 9K (aqua) ROM. Head measures between zero (bottom) to 300 (top) mmHg. Flow rate is measured from zero (left) to 12 (right) liters per minute.
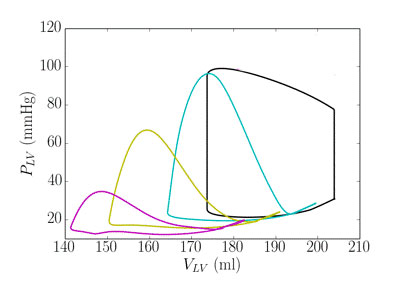
Image shows pressure (y-axis, from 1 to 120 mmHg) and V (x-axis, from 140 to 210 ml) in heart failure (black) and with left ventricular assistive device at speeds of 5K RPM (pink), 7K RPM (green), and 9K RPM (aqua).
Image (Top of page): Displacement mapping of interventricular interactions (from left to right) in heart failure and with HeartMate III at speeds of 5K, 7K, and 9K RPM, showing a displacement magnitude of between 1.2e+00 (red) and 7.1e-03 (blue)
Whether seasoned researcher, advanced student or curious undergrad, the Fan Flow Integrated Research Laboratory has opportunities for innovators of all types. For further information on current opportunities to get involved with the F2IRL, contact Principal Investigator Dr. Lei Fan.
